Articles in Uncategorized

On March 1, 2023, the Sugary Drinks Distributor Tax Advisory Committee (SDDTAC) submitted their annual report and budget recommendations to the Mayor, the Board of Supervisors and to the SF residents, who entrusted this 16-member committee to make community-driven funding recommendations that support services and innovative, community-led work to decrease consumption of sugary drinks, increase access to water, and support healthy eating, active living and well being. 

Although the report has been submitted, the work is far from over. Now is the time for the committee, its partners, and members of the public to urge the Mayor and Board of Supervisors to follow these recommendations. Read their annual report and recommendations.

By Jennifer Dhillon, CEO/Founder of Bounce Back Generation. Jennifer Dhillon is the CEO and Founder of Bounce Back Generation, one of the inaugural recipients of the Healthy Communities Grants funded by the soda tax. In this guest blog post, Jennifer shares findings from youth surveys and focus groups of youth about how they were coping with the effects of the pandemic, societal stress and trauma, and relates the findings to BBG’s Resilience Building Blocks.

In early 2022, Bounce Back Generation asked a group of young people living in San Francisco and East Bay neighborhoods how they were feeling. We focused on what they experienced during the height of the pandemic and how they were looking at life as COVID began to recede. We wanted to assess their resilience—or how they felt they were “bouncing back” from such a deeply challenging time.

Bounce Back Generation (BBG) works with youth who live in public housing and low-income areas. From our pre-pandemic work, we knew that a range of factors were contributing to decreases in the emotional, psychological and social well-being of young people. Gun violence, poverty, systemic racism, academic and school-related issues, bullying and social media use were already taking their toll. When we conducted tests for Adverse Childhood Experiences (ACEs) to this population, rarely did we record fewer than four ACEs. A score of four or more ACEs is connected with low academic and workplace achievements and mental and physical health problems later in life.[1]


[1] https://centerforyouthwellness.org/health-impacts/#:~:text=The%20higher%20your%20ACE%20score,stroke%2C%20cancer%2C%20and%20diabetes.

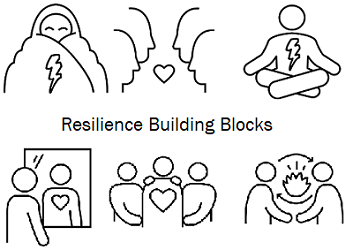
In late January 2022, we conducted 15 surveys and a focus group discussion with youth (ages 15 to 23) from the neighborhoods we serve. The goal of our outreach was to assess how well kids were coping by matching up how many were connected to resilience factors in their lives. Resilience, or the ability to “bounce back” after a traumatic event is more likely when we have certain life skills and conditions. These are exemplified in BBG’s Resilience Building Blocks: Protection, Relationships, Coping Skills, Confidence, Belonging and Storytelling. Through our work in high-stress communities, our training in trauma studies, and guidance from mental health professionals, we have identified these six key factors that help build our capacity to bounce back. We use them to teach resilient responses to toxic stress and trauma so that young people gain more personal awareness and joy in their lives-while potentially avoiding cognitive, emotional, and physical health harms associated with toxic stress and trauma.

Here are some highlights of what they shared with us.

We wanted to find out how the pandemic affected them emotionally and academically. We asked the participants to answer “Yes”, “No”, or “I don’t know” to the statement:

I feel my emotions got in the way of learning sometimes because I was unhappy, feelinglonely, anxious, or stressed during the lockdowns.

Close to 75% of respondents said “Yes”.

The remainder of the questions help us to understand whether they had those “Building Block” resilience factors in their lives to help them bounce back.

Protection

We all need places at home, school and in the neighborhood where we can feel protected. Lacking that safety means that a person may feel vulnerable or on high alert. Feeling unsafe can produce anxiety, which can lead to unwanted behaviors like being antisocial, acting out in aggressive and violent ways, or self harming.[2]


[2] https://www.centerforanxietydisorders.com/what-is-self-harm/

Survey question: During the pandemic did you have a place to go where you could express your emotions, relax, and feel safe and not anxious?

More than 50% of participants said “No.”

For those who said they did have a protected space, we asked them to explain more about that space.

“The pandemic gave me the push I needed to remodel my childhood room that I still live in, and I’ve been able to make my own space mine again.” Female, 19, African American

Respondents who didn’t feel safe discussed how this affected them:

“During the pandemic I felt like I had no one and no one cared about me.” Female, 18, African American

“I became more depressed and more closed off.” Female, 23, Mixed Race

“I broke down a few times, did some terrible things to people I care about and now I have to deal with some of those consequences.” Male, 21, Latinx

The last comment is instructive for those of us seeking to help reduce youth violence and self harm. When we feel unsafe and unprotected, our fight-or-flight responses can be triggered—leading to behaviors we often don’t know how to control, much less understand.[3]


[3] https://www.childwelfare.gov/topics/preventing/preventionmonth/about/protective-factors-aces/


We asked: Do you feel like you can ask for what you need emotionally or physically from friends and family?

A little over 65% said yes, they had someone to turn to. We have found that family and community connections can be strong in neighborhoods we serve.

“Yeah, because I trust and love them so I can talk to them.” 16, Male, African American

Yet, many felt their relationships were not as supportive as they needed. We got several responses like this:

“Honestly, I’m not sure. I’m still trying to find myself and I’m not sure what I need, but at the same time my answer is ‘yes’ because when I have my panic attacks there is somebody always in my corner ready to help me.” Female, 22, African American

But, answers like this highlight the need for greater understanding of what our youth need:

“I feel like I can ask most of my friends and family, but sometimes they don’t have the expertise or the ability to help with everything.”  19, Female, Mixed Race

Overall, we were heartened to find that so many of the young people who participated did feel some level of support and love around them, even if there were limitations to what those relationships could provide. This comment summed it up well:

“To an extent. When it comes to family, I have to keep in mind that there is a limitation as my parents are from a vastly different generation and culture than the one I grew up in. When it comes to emotional and mental health, it’s not talked about.” 22, Male, Latinx

COPING SKILLS

This building block teaches that there are a range of coping strategies—and what works for one person may not work for another. Both young and old turn to drugs, alcohol, or risky behaviors to cope with stress. While these may offer relief in the short term, they can make people feel worse later. Our motto is, “A good coping tool makes you feel good today and better tomorrow.”

We asked: Are the tools you use to cope satisfactory to help you manage your stress when it comes up? Or are they only partially or temporarily effective?

A third of our respondents said their coping strategies are “partially or temporarily effective.”

“The tools I use to cope when the stress comes up are temporarily satisfactory. Just for that moment when I’m stressing I would feel better, but after that all my thoughts would come back to me and I would feel bad or sad all over again.” 18, Female, African American

“I don’t really have any tools. I smoke my problems away.” 22, Female, African American

Less than 25% reported to us that they had some level of useful coping skills. Here are some examples:

“Couple of deep breaths to regroup and listening to music to calm myself down and separate from other distractions.” 16, Female, African American

“Yes, they are fully satisfactory when stress comes up.” 19, Male, African American

“The tools I use are decent but I still struggle with motivation and focus a lot which can lead to further stress and anxiety.” 19, Female, European American

CONFIDENCE

Confidence or self-efficacy, the belief we have the ability to affect the world around us with our actions, also help us manage how we deal with stress or recover from trauma. Building confidence is an ongoing process and challenge during middle school, high school, and early adulthood.[4]


[4] https://www.ncbi.nlm.nih.gov/pmc/articles/PMC5878202/

Our question sought to understand whether the participants achieved moments where they felt confident, accomplished or effective in their actions.

We asked: Is there something you do that makes you proud when you’ve accomplished it or finished it?

Several respondents listed finishing homework and completing chores as a sense of accomplishment. Others talked about their creative interests and physical activities:

“Working on my car always is a challenge because it’s often new to me. Seeing the finished work makes me take pride in my effort and the level of perfection I try to reach.” 21, Female, Asian American/Pacific Islander

“Yeah, go on my run at night.” 15, Male, African American

“When I finally hit that high/low note in a song or when the runs come out perfectly…music is and will always be my escape. It doesn’t always work though.” 22, Female, African American

“Yes, when I finish a gift for my parents it makes me proud.” 19, Male, African American

BELONGING

Belonging is about feeling connected to people who accept us as we are. It is a basic human need that is terribly tested when we feel loneliness or suffer from bullying.

We asked: “Please list at least 2 communities, groups, or places that you frequently interact with that understand you or are interested in the same things as you. This can be done virtually or in person. For example, church, online friend group, a gym .”

Twenty percent of participants said they didn’t have a group they felt connected to. Of the roughly 80% who did feel connected and accepted they mentioned the Boys and Girls Club, their friend/family group, or school. These spaces highlight the value of shared community programs. Interestingly, almost half cited some use of technology— like group chats, group texts, and online games—to feel connected to others.

“Me and all my friends have one big group chat and we do mental health check-ups with each other on Sundays and Saturdays. And sometimes we have mid-week check-ins just to see how things are going.” 22, Female, African American

“I have a friend group I often play video games with, and I have friends in my automotive technology classes.” 21, Female, Asian American/Pacific Islander

“Gym membership and my soccer team.” 22, Female, Mixed Race

We wanted to find out more about how they use the internet and social media to gain new skills or knowledge, but didn’t want to prompt them to say they used technology. This information was vital for us because Bounce Back Generation provides many of our services online.

So we asked them: Do you feel you had opportunities to learn more during the pandemic?

More than half said they did learn more and cited online resources. Of those learned more, only 10% cited using tools other than technology to gain knowledge by, for example, practicing something or reading a book. Most said they learned online or by watching television (e.g. documentaries) aided by the fact that the pandemic left them with time on their hands.

“I was online a lot more and learned about things I was interested in.” 22, Female Asian American/Pacific Islander

“I finished my last year of college online. I’m in my room in my apartment.” 22, Male, Latino

We asked about seeking help through counseling or therapy. Many of the participants told us they wanted to use therapy but found that it was unavailable to them, too expensive, or they didn’t know how to find appropriate help. This comment reflected a common sentiment.

“I think what really places a big factor is the environment offering resources. What helps people, including myself, feel comfortable reaching out for help is going in with the knowledge that I am going to a safe space where people want to help me. Cultivating a space like this is crucial for people to feel comfortable and safe enough to utilize resources.”

22, Male, Latino

We wanted suggestions about how they would ideally like to get emotional and mental health supports. We wanted advice on how we could offer our resources in ways that feel connected and welcoming. We asked, “What is the best way to make mental health resources available to young people?

Their suggestions included:

“Increase the social media outreach, text lines for resources, more youth ambassadors.”

21, Female, Mixed Race

“Having the resources in or close to their communities.” 19, Female, African American

“Make ads just so youth know it’s out there.” 23, Female, Mixed Race

“Showing them that they are there. Social media or emails.” 21, Male, Latinx

“Adhere to them, i.e., use tik tok/social media!” 22, Female, Asian American/Pacific Islander

“Infographics! / hosting safe spaces sessions (even on zoom) / incentivizing like providing free food at workshops.” 22, Male, Latinx

Despite the prevalence of technology use among young people, a few thought social connections in person are still important.

“We need to bring back the Big Brother, Big Sister programs because some kids don’t have older siblings that have possibly been through what they are dealing with right now, and I feel like it would help some kids.” 22, Female, African American

“Providing safe and consistent spaces for young adults to be able to freely express who they are, as well as creating new friendships and exploring new opportunities.”  16, Female, African American

STORYTELLING

Storytelling is the ability to share your experiences, thoughts, and perceptions with and learn from others. This vital component to building emotional and mental resilience requires that we ask ourselves questions like, “What happened?”; “How did I feel at the time?”; and “This is how I changed”.

To “story tell” you don’t always need a lot of time or a rapt audience. Most days we simply need someone to listen. We asked:

Is there someone you have that you can share information with when something happens to you? For example “I got a new job, I’m going to share this with my sister!”

Thankfully, all except two of our participants answered “yes”, they do have someone in their life to tell what happened to them. The remaining two answered “sometimes”. 

Through our survey and online focus group discussion we wanted to provide a space for the youth to tell us their stories and we now share those stories with you.

Are the Kids Alright? The answer is our young people are resilient but they could use the help of school, after school and community resources and programs. They all potentially offer some or all of the important Resilience Building Block factors – protection, opportunities for relationship-building, a place to teach healthy coping skills, foster confidence, create places to belong, and provide forums and opportunities for storytelling. These are the essential needs and foundational building blocks for life-long resilience.

Bounce Back Generation creates and shares tools to build resilience. Our new website BBGtv.org (launching February 2023) targets youth 16 to 24 years of age and provides media produced by young people hired from the communities we serve. Teaching tools include the Building Blocks for Resilience, Your Hero’s Journey, mindfulness and meditation, “parts work”, and cognitive behavioral self-care. We partner with organizations that offer online group supports and maintain a list of links for local, state and national hotlines and youth assistance programs. To learn more visit bouncebackgeneration.org and BBGtv.org.
Happy New Year! 2023 marks the 5-year anniversary of San Francisco’s soda tax.

With COVID-19 here to stay, 2022 brought new challenges to face as a society, like inflation. When time and money are tight, buying cheap food or drinks seems like a smart thing to do to stretch the dollar. But there’s more to deciding what to eat. In her book, How the Other Half Eats, Dr. Priya Fielding Singh explores how and why we eat the way we do. For example, some parents with limited incomes want to feel like they can give their children something special. While they may have to say “no” to a laptop or a trip to Great America, they can afford to say “yes” to a candy bar, a fast food meal or a soda. But the issue is more complicated than “just saying no”, especially when inflation plays a role. Did you know that San Francisco has programs that teach families how to make healthy foods with limited time and budget? The SF Soda Tax funds some of these programs.

SFDPH has heard from the community that they don’t know what the soda tax has funded and who is benefiting from the funding. To address this knowledge gap, our evaluation partners, Raimi + Associates, are developing a data dashboard with online maps and charts that describe how the soda tax funds are serving SF by race/ethnicity, income, neighborhood, and select health outcomes. These data will be regularly updated and will be available to the public.

2022 was a busy year for the Sugary Drinks Distributor Tax Advisory Committee (SDDTAC). This year, the revenue from the tax in Fiscal Year 2022-23 was $13,740,000. After mandated set-asides, the SDDTAC will be making recommendations for $11 million for the Fiscal Year 2023-24 and 2024-25. The Committee always wants to hear from community members; you can attend their online meetings to comment on their recommendations – their meeting information can be found here. The committee is using the Aliah Think Tool to streamline the decision-making process. Once the SDDTAC sends their final recommendations to the Mayor’s Office and the Board of Supervisors, the work isn’t done! The next phase is to meet with policymakers and educate them about the SDDTAC’s process and encourage them to support the recommendations.

Since 2018, soda tax champions like SPUR and the Shape Up SF Coalition have organized these meetings with the Board of Supervisors. If you are interested in joining SPUR, Shape Up SF, and SDDTAC members to promote the 2023 recommendations, reach out to Paloma Sisneros-Lobato or Blythe Young.

We hope that the meetings with the Board of Supervisors and the new maps and data will help show the impact that the soda tax is having in San Francisco.

The San Francisco Public Health Foundation (SFPHF), in collaboration with the San Francisco Department of Public Health (SFDPH), is seeking panelists to serve on the community grants review panel for the 2023 Healthy Communities Grants Request for Proposals.

This is a great opportunity for community leaders who are interested in health and wellness and who have deep connections to San Francisco communities that are most harmed by sugary drinks and related illnesses (Black/African American, Latinx, Pacific Islander, Native American/American Indian, Asian, and Low-Income Populations). Panelists will have the opportunity to have a say in projects that get funded in their communities and be paid up to $575. No prior experience is necessary, and training will be provided.

Please help us spread the word by sharing this opportunity with your networks! Applications are due February 6, 2023.

Visit https://sfphf.org/cgrp for more information.

·    DOWNLOAD or VIEW details about the 2023 Community Grants Review Panelist Application Process
·    DOWNLOAD or VIEW the PDF Version of the Application
·    APPLY ONLINE
·    DOWNLOAD or VIEW a printable flyer

By Paloma Sisneros-Lobato, Food and Agriculture Senior Policy Associate
Each year SPUR tracks how Oakland and San Francisco allocate the revenues from soda taxes, which are meant to reduce the harms of soda consumption. Specifically, we’ve looked at how well each city’s budget reflects equity-focused recommendations aimed at keeping the spending aligned with the taxes’ stated purpose. This year, we added a new dimension to our analysis by asking whether the two taxes reflect key principles of good government. We found that their implementation could be more transparent and efficient.

Sugar-sweetened drinks are the single-largest source of sugar for American adults and children, and research shows that they are associated with many diet-related diseases, including diabetes. Sugar-sweetened beverage (SSB) taxes are one tool that policy makers around the country have been exploring to try to reduce soda consumption and fund healthy eating and active living initiatives in their cities. The Bay Area has been a leader in this movement: Berkeley passed the nation’s first SSB tax in 2014; Oakland and San Francisco residents voted to implement SSB taxes two years later.

To increase the chances that they would pass at the ballot, the Oakland and San Francisco soda taxes were designed as general taxes rather than specific taxes, which means that they have no specified funding allocations. (Compared with specific taxes, which require a 66% affirmative vote, general taxes require only a 50% yes vote.) The structure of general taxes required Oakland and San Francisco to establish advisory boards to make recommendations about how SSB revenue should be spent each year. These boards have no decision-making power. The final call on the budget is left to city leaders — the mayor and members of either the city council or the board of supervisors — who are not required to adopt the recommendations.

Every year, SPUR analyzes how San Francisco and Oakland are allocating SSB tax revenue and whether the advisory boards’ recommendations are followed. This year, we took our research one step further, assessing whether implementation of these SSB taxes reflect two key principles of good government: (1) transparency and (2) effectiveness. In short, our goal is to understand whether Oakland and San Francisco are implementing SSB taxes in an equitable way that benefits the low-income and primarily communities of color most burdened by the SSB industry.

Oakland

Transparency
To assess the SSB budget in Oakland, we first reached out to the SSB Community Advisory Board to obtain the approved budget and annual recommendations, information not published directly on the board’s website. We then used these figures to highlight the differences between the advisory board’s recommendations and the final budget.

To track the spending and allocations, SPUR used the city’s live database with the most up-to-date budget figures for the City of Oakland. Although the database is intended to be a transparency tool, it proved challenging to navigate. Moreover, many of its labels do not match those of other city budget documents, including the Comparison of Oakland Advisory Board Recommendations and Final Budget that we obtained from the Community Advisory Board.

Effectiveness
When we compared the Community Advisory Board’s recommendations to the final approved budget, we found that the Oakland mayor and city council did not take the Sugar-Sweetened Beverage Community Advisory Board’s recommendations into account in any meaningful way. The advisory board proposed that the Oakland budget allocate 60% of the Fiscal Year 2022–23 revenue to community-based grants. The approved budget allocates just 25% for that purpose. Although the advisory board called out this disparity to the mayor and city council in numerous letters, no changes to the final budget resulted.

Comparison of Oakland Advisory Board Spending Recommendations and Final Budget FY22–23

Table 1. Comparison of Oakland Advisory Board Spending Recommendations and Final Budget FY22–23

Oakland’s city budget has faced challenges for years, threatening many city services with elimination or underfunding. The spending allocation from the SSB tax suggests that Oakland is using the revenue from this tax to fill voids in the city’s General Fund rather than to support programming specifically targeted at improving healthy living in line with the tax’s original intent. The divergence of the city’s revenue allocation from the advisory board’s recommendations reflects ineffective implementation of the SSB tax. 

San Francisco

Transparency 

To assess the budget in San Francisco, SPUR used the mayoral budget and the Sugary Drinks Distributor Tax Advisory Committee (SDDTAC) recommendation comparison document that is published on the SDDTAC website. We calculated the difference between the recommendations and the approved budget. Overall, information about the recommendations and the budget is easy to find under resources on the committee’s website.  

Effectiveness

The SDDTAC makes recommendations for six major funding categories. In general, the City and County of San Francisco FY22–23 budget loosely matches those recommendations. The allocations diverge from the recommendations in a few notable respects. 

First, the budget allocated no funds to Food as Medicine Medi-Cal. These funds would have provided one-time infrastructure and capacity-building grants for community-based organizations that already provide medically supportive food and nutrition interventions. These organizations would have used the grants to contract with health plans to take advantage of Medicaid funding available through CalAIM, California’s current Medicaid waiver.

Second, the city did not fully fund healthy food purchasing supplements. These supplements provide support for programs that help low-income San Franciscans buy healthy foods — programs directly aligned with the goals of the SSB tax. 

Third, the city allocated significantly more money than recommended to the city’s free Requity program, which is operated through the Recreation and Parks Department. The funds for outreach and scholarships and for equity building in city recreation programming are meant to improve the health and wellness of San Francisco youth. This programming is certainly beneficial. But the large percentage of the SSB tax revenue allocated for it is concerning because funding from SSB tax revenue should not supplant funding for programs traditionally supported through the General Fund. 

Comparison of SDDTAC’s Spending Recommendations and San Francisco Mayor’s Proposed Soda Tax Allocations FY22–23

Table 2. Comparison of SDDTAC’s Spending Recommendations and San Francisco Mayor’s Proposed Soda Tax Allocations FY22–23. Source: SDDTAC

Bay Area SSB Taxes Can Set a Precedent for a Statewide SSB Tax

Researchers, government officials and advocates continue to look to Oakland and San Francisco as exemplars of soda tax campaigns. Because any potential future statewide SSB tax would likely pursue goals similar to those of the Oakland and San Francisco SSB taxes, it’s important to track how well tax administration reflects good government principles and how revenue allocation is impacting targeted communities. SPUR recommends that both the Oakland and San Francisco mayors better align the final budget allocation of SSB taxes with their advisory board’s recommendations. The advisory boards dedicate significant time and resources to identifying recommendations aimed at equitable distribution of funds, and their recommendations should be followed more closely. SPUR will continue to compare the Oakland and San Francisco budgets with advisory board recommendations to assess whether the allocation of SSB revenue aligns with the goals of the SSB taxes. 

Kids are back in school and the long summer nights are dwindling down, which also means that San Francisco’s new fiscal year has begun as of July 1st.  The Mayor and Board of Supervisors have finalized the City budget and now communities are determining if their recommendations were heard and can be put into action.  The City budget can be confusing, to say the least, and in our case it’s the Sugary Drinks Distributor Tax (SDDT) budget.  Let’s dissect how the SDDT budget process works and more specifically – how the communities most impacted by the soda industry’s targeting and marketing tactics can provide input on where they’d like the money to go. We will also refer to it as the soda tax for shorthand, even though it’s not just sodas subject to the tax.

Before we dive in, let’s get on the same page about how the soda tax works. The Sugary Drinks Distributor Tax levies one penny ($0.01) per ounce on distributors of bottled sugar sweetened beverages, syrup or powder in San Francisco.  This also includes “self-distributors”, merchants  who bring drinks into the City for retail sale.  Therefore, distributors are responsible for paying the tax. Merchants may choose to pass the cost of the tax along to consumers who purchase sugar-sweetened beverages – and it appears to be the case that most store owners pass the tax along to their customers. The sugary drinks distributor tax is a general excise tax, which means that the money from the tax goes into the city’s general fund.  

So, what does that mean?  Well, any money collected from the SDDT will go to the city’s general pot of funds and can be used for anything the City’s elected officials want to use it for.  When the tax was approved by voters, the intent of the tax revenue was to invest the funds to support low income and people of color who are most targeted by the beverage industry’s advertising.  Annually about $15Mil is collected from the Sugary Drinks Distributor Tax. About 22% of that is taken off immediately and set aside for specific, previously voter-approved projects. The remaining revenue is then available for other projects, and that’s where the Sugary Drinks Distributor Tax Advisory Committee comes in. 

When voters passed the tax, they also approved the creation of a Sugary Drinks Distributor Tax Advisory Committee (SDDTAC). The intent of the committee is to make recommendations to the Mayor and Board of Supervisors on the effectiveness of the tax.  Annually, the advisory committee has two tasks:

  1. Submit a report that evaluates the impact of the tax on beverage prices, consumer purchasing and behavior, and public health, and 
  2. Make budget recommendations on the funding of community programs that reduce the consumption of sugar sweetened beverages in San Francisco.  

The voluntary advisory committee spends about 5 hours monthly to do this work.  During budget season, when the committee is developing recommendations for the Mayor, committee members spend, on average, up to 10 hours per month to ensure that they are hearing and proposing accurate needs of the community as it relates to addressing health disparities and breaking down structural inequities.  

How you can participate

Prior to the COVID 19 pandemic, the SDDTAC meetings were in person meetings where the public was welcomed to participate and voice their opinions/recommendations as it related to the tax. People participated in this process, but sometimes, it could be a logistical challenge. The meetings are in the evenings, parking in the city can always be a nightmare, kids are home from school – in general, life can get in the way.  However, during the pandemic, the SDDTAC meetings went  virtual (and still are!) and community members continued to provide feedback and input at the monthly meetings.  The committee works tirelessly to capture what they have heard from community members’ experiences and challenges and that the collected revenue is being reinvested back into the community where community members can benefit from the tax.  Although there is not an expected date of return to in person committee meetings, the SDDTAC is experimenting with a special hybrid meeting (in person and virtual) on September 7, 2022.  The hope is that future SDDTAC meetings can be hybrid to provide convenient options for community members to continue to participate. 

So, what happens after the recommendations from the Advisory Committee are submitted?  The Advisory Committee submits its recommendations report (budget recommendations and evaluation) to the Mayor’s Office and Board of Supervisors in early March. By April or May, the Mayor submits her proposed city budget (which includes the sugary drinks distributor tax funding recommendations) to the Board of Supervisors. At any point during this process, community members are welcome to voice their opinions to city leadership (the Mayor and Board of Supervisors) with their preferences for where the funds should be directed. When constituents from their districts share their concerns, policy makers listen. In June or July, the Board of Supervisors votes on the City budget and the Mayor signs it, which is finalized for the current fiscal year. SDDT funds are then transferred to city departments who either implement the programs/services directly or issue grants to community-based organizations to carry out their important work related to chronic disease prevention, decreased consumption of sugary sweetened beverages and community building.   

The budget process can be daunting and lengthy but the SDDT advisory committee budget discussions and negotiations are truly working towards an effort to impact our most vulnerable communities. This year, the Mayor funded 80% of the SDDTAC recommendations. With continued partnership and increased input and participation from our community throughout this process, perhaps we can get even more alignment with the Mayor’s budget. Standing tall, speaking out and fighting the good fight for a healthier San Francisco is worth it!